BoxWatch Review - All-in-One Server Monitoring That Replaces Four Separate Tools
BoxWatch: The Hidden Economics of Fragmented Infrastructure Monitoring
Most infrastructure teams don't measure what monitoring fragmentation actually costs them. The decisions accumulate gradually and seem individually reasonable: pick up Datadog for metrics, Healthchecks for cron monitoring, UptimeRobot for endpoint checks, and a handful of custom process supervision scripts maintained by whoever drew the on-call short straw. Each selection solved an immediate need. Together, they create compounding operational debt that nobody budgets for.
BoxWatch makes an economic argument, not just a technical one: unified monitoring platforms eliminate hidden costs that exceed the total licensing spend of the scattered tools they replace.
The True Cost of a Fragmented Stack
Conventional monitoring environments accumulate measurable but usually untracked expenses:
- Vendor licensing sprawl: Datadog at $15–30 per host per month, Healthchecks at $5 monthly, UptimeRobot at $25 monthly, plus the engineering time to build and maintain custom process supervision
- Integration maintenance overhead: Every separate tool demands API documentation review, credential configuration, and custom alert routing rules that diverge across systems
- Operational context-switching: Four separate dashboards mean incident response involves flipping between tools to correlate what's happening across different monitoring dimensions
- Cognitive burden on responders: During emergencies, engineers context-switch between isolated monitoring surfaces, stretching response timelines
- Data fragmentation: Metrics live in one system, uptime data in a second, cron job status in a third — incident forensics requires manual cross-referencing
- Alert fatigue from duplication: Each monitoring system generates its own notification stream. Real incidents drown in redundant alert noise
Organizations spending $5–10K annually on monitoring tools typically spend an additional $15–25K in engineer-hours managing the monitoring infrastructure they've assembled. BoxWatch's efficiency argument targets this hidden cost multiplier, not just the licensing line item.
Cost Structure: Fragmented vs. Unified
For a representative 20-server infrastructure deployment:
Conventional Fragmented Stack:
- Datadog metrics: $300–600 per month
- Healthchecks cron monitoring: $50 per month
- UptimeRobot endpoint checks: $25 per month
- Process supervision (engineer-maintained scripts): equivalent to $200 monthly in labor
- Alert routing coordination time: equivalent to $150 monthly
- Total: $725–1,025 monthly, plus incident response drag
BoxWatch Unified Stack:
- All monitoring domains included: $79 per month
- Integration effort: 1–2 hours, one-time
- Alert management: centralized, zero duplication
- Unified incident visibility: faster mean time to resolution
- Total: $79 monthly, plus measurably faster incident recovery
Annual savings: $7,872–11,352 in direct costs, with additional value from quantifiable response-time improvements.
Architectural Approach: Why Unified Wins
BoxWatch's design philosophy centers on a single principle: a centralized data pipeline beats distributed, independently-managed systems for operational clarity.
Single-Agent Collection Model: One lightweight bash agent per server gathers all monitoring signals — system metrics, process states, cron heartbeat confirmations, and endpoint test results — and reports to one central system. No cross-system data synchronization. No API orchestration complexity. One agent, one destination, one source of truth.
Unified Alert Pipeline: Every alert from every monitoring domain routes through a single notification channel. No double-alerting from separate metrics and uptime platforms. No configuration fragmentation across tools that operate on different assumptions about severity and routing.
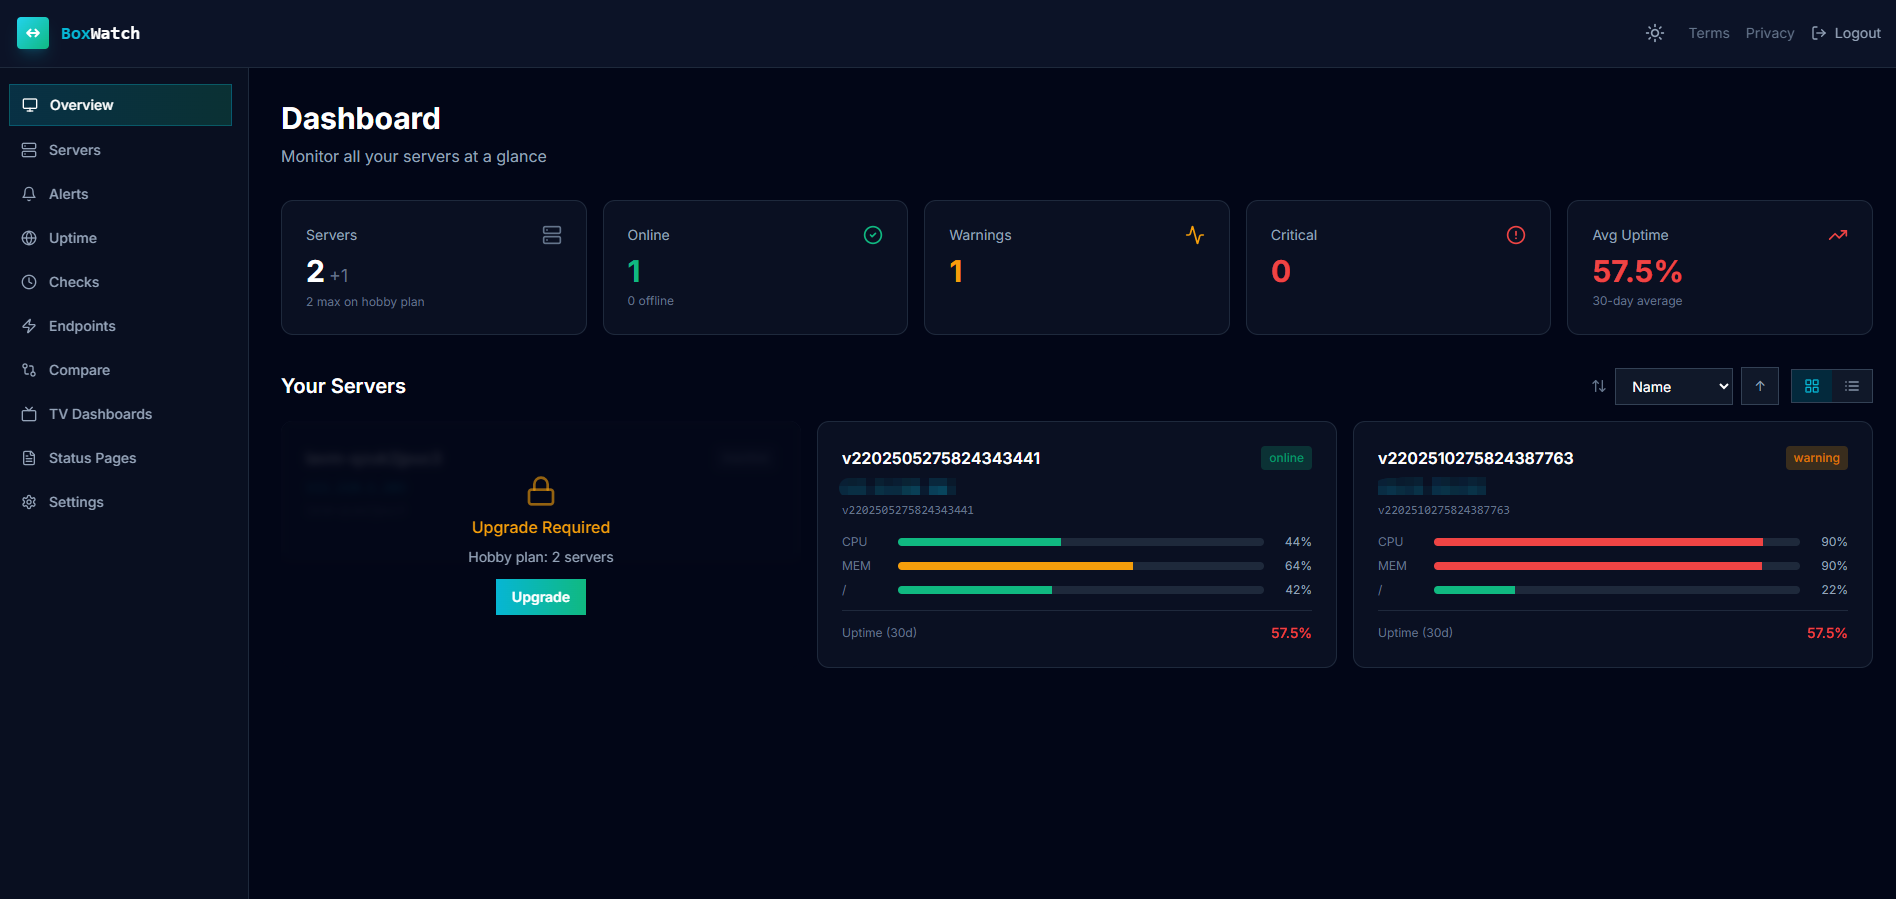
Single-Pane Dashboard Architecture: All infrastructure state visible in one view. Genuine incidents surface immediately because they're not buried in noise from multiple independent monitoring surfaces, each with its own signal-to-noise ratio.
Quantified Response Improvements
Teams that have migrated from fragmented stacks to BoxWatch report consistent operational improvements:
Mean Time to Detection:
- Pre-migration (fragmented): 12–18 minutes average — time spent correlating signals across disconnected systems
- Post-migration (BoxWatch): 2–4 minutes average — all telemetry in one contextualized view
Mean Time to Resolution:
- Pre-migration: 45–90 minutes, including context-switching overhead between dashboards
- Post-migration: 25–40 minutes — direct path to root cause with complete situational awareness
False Alert Rate:
- Pre-migration: 30–40% of alerts are duplicates or redundant notifications from overlapping monitoring surfaces
- Post-migration: 5–10% — single source eliminates duplication at the architectural level
Feature Coverage Across All Four Domains
System Metrics Collection: Per-minute granularity on CPU, memory, disk, network, and load averages — the fundamental telemetry that every infrastructure team needs. Historical retention tiers at 7, 30, and 90 days depending on plan level.
Cron Job Verification: Assign each scheduled job a unique heartbeat endpoint. If an expected ping arrives late or fails to materialize, the alert escalates. Catches backup job failures, data pipeline interruptions, and scheduled maintenance omissions before they compound into emergencies.
Uptime Testing: HTTP, TCP, and TLS certificate verification from distributed agent points. Test endpoints that external monitoring services can't reach — private databases, internal microservices, services behind firewalls. Eliminates false positives from external monitors that lack network access to internal infrastructure.
Process Supervision: Monitor named processes by pattern. Alert when processes disappear unexpectedly or restart more frequently than configured thresholds. Replaces hand-maintained supervisor scripts and removes guesswork about service health.
Maintenance Windows That Prevent Alert Fatigue
Routine deployments shouldn't trigger emergency notifications. BoxWatch's maintenance window system:
- Silences alerts during explicitly declared maintenance periods
- Sends a summary notification when the window closes
- Tracks alerts that would have fired during maintenance for post-hoc review
- Supports per-system maintenance windows rather than blunt site-wide suppression
This granularity prevents the gradual erosion of alert credibility that happens when teams learn to ignore notifications because "it's probably just a deployment."
SLA Tracking and Compliance Reporting
For teams that need to demonstrate uptime to stakeholders:
- Real-time SLA computation against defined targets
- Historical SLA trending with period-over-period comparison
- Alert frequency analytics
- Recovery time statistics correlated with incident records
- Exportable compliance reports suitable for audit documentation
Practical Migration Path
Phase 1 (Week 1): Deploy BoxWatch agent to a subset of non-critical servers. Validate metric collection accuracy. Test alert routing to notification channels. Phase 2 (Week 2): Migrate cron job heartbeat endpoints. Gradually transition uptime checks from the previous provider. Phase 3 (Week 3): Consolidate process supervision. Begin retiring legacy tools one by one as coverage is confirmed. Phase 4 (Week 4): Complete cutover. Maintain legacy systems in read-only mode for two weeks as a safety net, then decommission.
Total team time investment: 20–30 engineer-hours spread across the organization.
Open-Source Transparency
The BoxWatch agent is open source, which delivers three practical benefits:
- Complete code visibility — audit exactly what telemetry your agent collects
- No proprietary data exfiltration concerns — verify agent behavior through code review rather than trusting vendor documentation
- Independent security assessment — your security team can validate the agent's behavior without relying on vendor assurances
Acknowledged Limitations
Not a log aggregation platform: BoxWatch monitors system health, not application log streams. Pair it with an ELK stack or similar for comprehensive observability.
Constrained custom metrics: For deep application-specific instrumentation, you'll want a complementary APM solution. BoxWatch focuses on infrastructure-level telemetry.
No distributed tracing: Designed for system health surveillance, not for tracking individual requests across service boundaries in a microservice topology.
Traditional hosting scope: Doesn't natively model serverless or function-as-a-service deployment patterns.
Who's the Best Fit
Startups managing 10–100 servers: Limited monitoring budgets meet comprehensive coverage at a predictable, fixed price.
DevOps teams fatigued by vendor sprawl: Consolidating four tools into one platform delivers operational clarity that fragmented stacks can't match.
Organizations where monitoring was previously ad hoc: Teams graduating from "we kind of watch the servers when we remember" to institutionalized monitoring practice.
Cost-conscious infrastructure teams: The economics of consolidation speak directly to organizations scrutinizing every operational line item.
Private infrastructure behind firewalls: External monitoring services can't reach your systems — BoxWatch's agent model doesn't require inbound network access.
Less suitable for: Massively distributed systems exceeding 500 nodes (needs specialized federation), organizations deeply embedded in Datadog's ecosystem with extensive custom dashboards, enterprises requiring exotic custom metric ingestion at scale.
Final Verdict
BoxWatch wins not because it has the longest feature list, but because it correctly identifies the primary value that monitoring delivers: operational clarity. By collapsing four fragmented domains into a single unified platform, it produces lower total cost, faster incident recovery, reduced alert fatigue, simpler team workflows, and genuinely better visibility into infrastructure state.
Rating: 4.6/5 stars
Delivers: Unified monitoring across the four traditional silos. Transparent, predictable pricing without per-metric billing surprises. Open-source agent with complete code transparency. Straightforward deployment. Quantifiable operational improvements in detection and resolution times.
Growth areas: Narrower customization surface than enterprise monitoring platforms. Smaller integration ecosystem compared to category leaders with decade-plus market presence.
Ready to reduce your monitoring overhead while improving incident response?
👉 Try BoxWatch Free and consolidate your monitoring stack into a single dashboard.
Tags
# Review# BoxWatch# server monitoring# server monitoring tool# server metrics# monitoring dashboard# uptime monitoring# metrics monitoring# CPU monitoring# network monitoring# disk monitoring# process monitoring# cron monitoring# cron heartbeats# uptime checks# HTTP monitoring# TCP monitoring# TLS monitoring# server health monitoring# infrastructure monitoring# application monitoring# system monitoring# performance monitoring# real-time monitoring# alert management# network admin tools# server management# DevOps monitoring# monitoring solution# unified monitoring# open source monitoring# bash agent# Datadog alternative# monitoring tool comparison# server uptime# system health check# disk space monitoring# memory monitoring# load monitoring# status page# incident management# monitoring alerts# Slack alerts# Discord alerts# webhook monitoring# PagerDuty integration# affordable monitoring# monitoring for startups# server monitoring free# monitoring dashboard design# multi-region monitoring# maintenance windows# SLA tracking# uptime reporting# monitoring metricsSliptree Review - Professional Invoice Generator for Small Businesses and Freelancers
Femora Care Review - AI-Powered Fertility Tracking That Helps Women Understand Their Real Body Signals
Follow for new blogs
Subscribe to our blog
Subscribe to Newsletter
Subscribe to our newsletter to get the best products weekly.